Copy of Water Quality Report
Consumer Confidence and Water Quality Report - 2025
Reliabile Quality, Innovation for the Future - A Message from the GM
At Las Virgenes Municipal Water District (LVMWD), our mission is simple: to provide safe, high-quality water reliably and, affordably, and with environmental responsibility at the forefront. As California continues to navigate the challenges of a changing climate, aging infrastructure, and increasing demands on limited water supplies, we remain focused on protecting public health while investing in a resilient water future for our communities.
I am proud to report that once again, the drinking water delivered to your homes and businesses met or exceeded every state and federal drinking water standard. In 2025, our dedicated team collected more than 1,200 water samples and conducted more than 11,000 tests to ensure your water remained safe, clean, and dependable every time you turned on the tap. The results of those efforts are detailed in this report.
Providing reliable water service also means planning for the future. Earlier this year, LVMWD broke ground on the largest infrastructure project in its history, tomorrow. Over the past year, LVMWD made significant progress in diversifying and strengthening local water supplies. Construction activities began on the Pure Water Project Las Virgenes-Triunfo, which will provide up to thirty percent of LVMWD’s water supply once completed. a. This projectcritical investment in our water system represents one of the most important steps we can take to reduce dependence on imported water and improve drought resilience for generations to come.. critical investment that will eventually provide up to 30 percent of LVMWD's water supply. This project represents one of the most important steps we can take to reduce dependence on imported water and improve drought resilience for generations to come.
We have also expanded regional partnerships to improve water reliability. Through innovative programs such as our Water Storage and Exchange Program and continued collaboration with neighboring agencies, LVMWD is building a more flexible and resilient water supply portfolio capable of adapting to changing conditions.
Conservation and smart water use remain essential components of that strategy. From landscape transformation incentives and irrigation efficiency upgrades to customer tools that help track water use and identify leaks, we continue to help customers use water wisely while maintaining beautiful and functional landscapes. The most sustainable water source is the water we save together.
At the same time, we remain committed to operational excellence. Investments in modern infrastructure, renewable energy, advanced treatment technologies, and data-driven system management help us maintain high levels of service while responsibly managing costs for our customers.
Every action we take is rooted in our commitment to the people we serve. Whether safeguarding water quality, investing in local water supplies, or preparing for future challenges, our goal is to ensure that reliable, high-quality water remains available for our communities today and for generations to come.
Thank you for your continued trust in Las Virgenes Municipal Water District.

David Pedersen, PE
11,000 Tests on 1,200 Samples Every Year
Every year, LVMWD diligently executes extensive state-mandated testing for water quality constituents by collecting over 1,200 water samples, taken from the drinking water system, and conducts over 11,000 laboratory analyses, in a state-certified water quality lab, to ensure high-quality drinking water and public health. These tests are conducted by highly-trained and skilled professionals. This continuous and important routine ensures that our water is not only safe to drink but also is consistently the best it can be. Yet, 39% of customers that prefer bottled water drink it because they believe it is of higher quality than tap water. While bottled water companies are also required to conduct testing for water quality through the Food and Drug Administration, water utilities in California are required by the State Division of Drinking Water to undergo, arguably, the most stringent and comprehensive water quality testing in the United States, if not the world. LVMWD continues to meet or exceed all the standards for safe and high-quality drinking water as established by state mandates.
These tables may contain complex measurements and terminology, but they also contain valuable information about the water delivered to your tap. The District is required to report contaminants that are detected; none were found at levels considered to be unsafe or unhealthy in LVMWD tap water.
LVMWD is entirely dependent upon water imported from elsewhere; there are no local drinking water sources. The supply to our region travels hundreds of miles from Lake Oroville in the Sierras via the State Water Project and is then treated and conveyed to the District by the Metropolitan Water District of Southern California (MWD). LVMWD is one of MWD’s 26 member agencies.
Your water is routinely tested before it ever reaches the tap. This report conveys the results of tests conducted in 2024. Readers of this report sometimes ask if the substances identified in the report are harmful. It is normal to find trace amounts of contaminants in tap water or bottled water unless it is distilled or treated through a process such as reverse osmosis. Trace salts and minerals are natural and keep water from tasting “flat.”
The sources of drinking water (both tap and bottled water) include rivers, lakes, streams, ponds, reservoirs, springs, and wells. As water travels over the surface of the land or through the ground, it dissolves naturally-occurring minerals and various contaminants.
Contaminants that we test for and may be present in source water include:
- Microbes, such as viruses and bacteria that may come from sewage treatment plants, septic systems, agricultural livestock operations, and wildlife.
- Inorganics, such as salts and metals, that can be naturally-occurring or result from urban stormwater runoff, industrial or domestic wastewater discharges, oil and gas production, mining, or farming.
- Pesticides and herbicides that may come from a variety of sources, such as agriculture, urban stormwater runoff, and residential uses.
- Radioactive materials that can be naturally occurring or the result of oil and gas production and mining activities.
- Organic chemicals, including synthetic and volatile organic chemicals that are byproducts of industrial processes and petroleum production. These chemicals can also come from gas stations, urban stormwater runoff, agricultural operations, and septic systems.
In order to ensure that tap water is safe to drink, the U.S. Environmental Protection Agency (USEPA) and the State Water Resources Control Board (SWRCB) prescribe regulations that limit the amount of certain contaminants in water provided by public water systems.
Drinking water, including bottled water, may reasonably be expected to contain small amounts of some contaminants. The presence of contaminants does not necessarily indicate that the water poses a health risk.
More information about contaminants and potential health effects can be obtained by calling the USEPA’s Safe Drinking Water Hotline at (800) 426-4791.
Health Advisory for Persons with Weakened Immune Systems
Some people may be more vulnerable to contaminants in drinking water than the general population. People who are immunocompromised, such as those undergoing chemotherapy, those who have undergone organ transplants, those with HIV/AIDS or other immune system disorders, and some elderly and infants, can be particularly at risk from infections. These people should seek advice from their health care providers about drinking water.
USEPA/Centers for Disease Control (CDC) guidelines on appropriate means to lessen the risk of infection by cryptosporidium and other microbial contaminants are available by calling the Safe Drinking Water Hotline at (800) 426-4791.
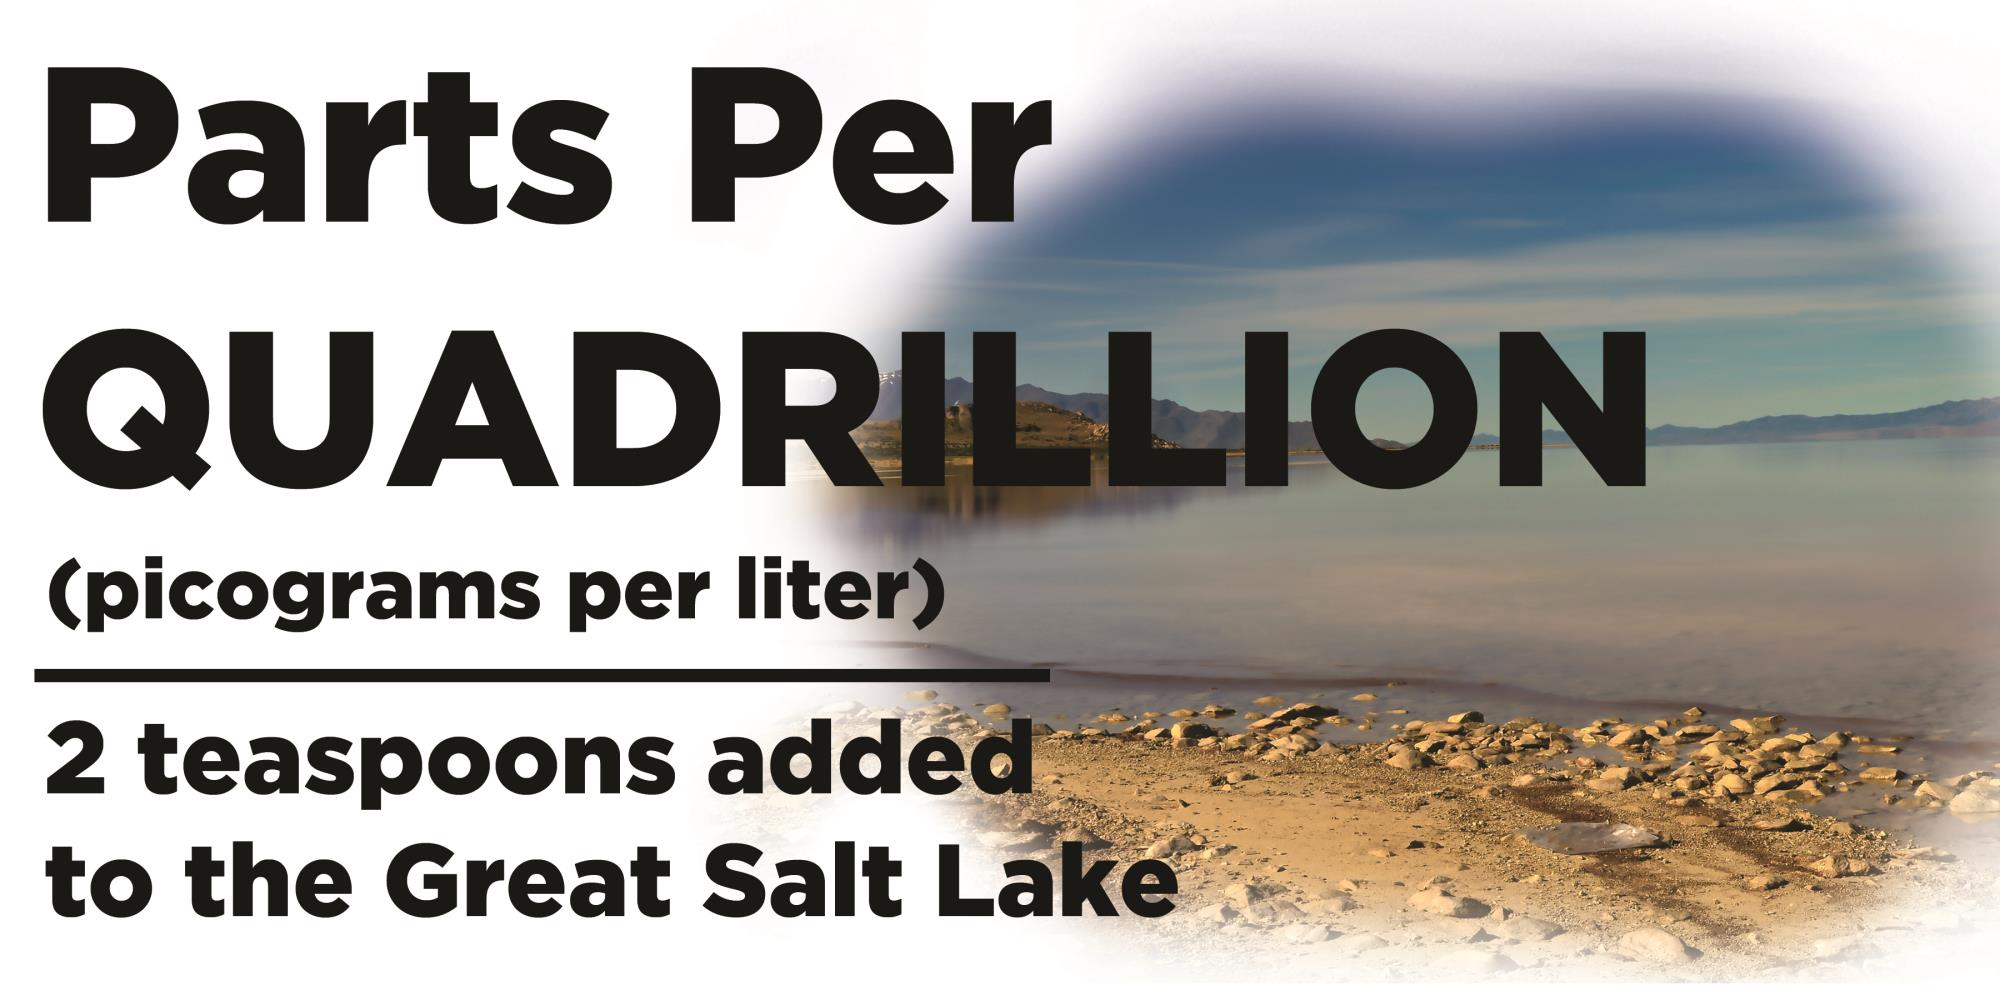
When evaluating the presence of contaminants in your water, consider the following comparative measures:
- One part per million (milligrams per liter) equals three drops added to a 42-gallon barrel.
- One part per billion (micrograms per liter) equals one drop added to a large tanker truck.
- One part per trillion (nanograms per liter) equals ten drops added to the Rose Bowl Stadium filled with water.
- One part per quadrillion (picograms per liter) equals two teaspoons added to Utah’s Great Salt Lake.


How to read these water quality tables.
These tables may contain complex measurements and terminology, but they also contain valuable information about the water delivered to your tap. The District is required to report contaminants that are detected; none were found at levels considered to be unsafe or unhealthy in LVMWD tap water.
Testing results are presented for source water from the Jensen Water Treatment Plant operated by the Metropolitan Water District of Southern California (MWD) and for LVMWD’s water delivery system. The values provided in the “LVMWD” column more closely represent the quality of water delivered to most homes and businesses. Should you have any questions or need clarification, please call us at (818) 251- 2200, or contact any of the agencies listed in this report under “Additional Information.”
View or Download the 2024 LMVWD Water Quality Data presented below as a PDF.Definition of Terms and Footnotes
| Average | Result based on arithmetic mean |
|---|---|
| CCRDL | Consumer Confidence Report Detection Level |
| CaCO3 | Calcium Carbonate |
| CFE | Combined Filter Effluent |
| CFU | Colony-Forming Units |
| DLR | Detection Limits for Purposes of Reporting |
| EPA | Environmental Protection Agency |
| HAA5 | Sum of five haloacetic acids |
| HPC | Heterotrophic Plate Count |
| LRAA | Locational Running Annual Average; highest LRAA is the highest of all Locational Running Annual Averages calculated as an average of all samples collected within a 12-month period |
| LVMWD | Las Virgenes Municipal Water District |
| MCL | Maximum Contaminant Level |
| MCLG | Maximum Contaminant Level Goal |
| MRDL | Maximum Residual Disinfectant Level |
| MRDLG | Maximum Residual Disinfectant Level Goal |
| MWD | Metropolitan Water District |
| NA | Not Applicable |
| ND | Not Detected at or above DLR or RL |
| NL | Notification Level to SWCRB |
| NTU | Nephelometric Turbidity Units |
| pCi/L | picoCuries per Liter |
| PHG | Public Health Goal |
| ppb | parts per billion or micrograms per liter (µg/L) |
| ppm | parts per million or milligrams per liter (mg/L) |
| ppt | parts per trillion or nanograms per liter (ng/L) |
| RAA | Running Annual Average; highest RAA is the highest of all Running Annual Averages calculated as an average of all the samples collected within a 12-month period |
| Range | Results based on minimum and maximum values; range and average values are the same if a single value is reported for samples collected once or twice annually |
| RL | Reporting Limit |
| SI | Saturation Index (Langelier) |
| SWRCB | State Water Resources Control Board |
| TDS | Total Dissolved Solids |
| TON | Threshold Odor Number |
| TT | Treatment Technique is a required process intended to reduce the level of a contaminant in drinking water |
| TTHMs | Total Trihalomethanes |
| μS/cm | microSiemen per centimeter; or micromho per centimeter (μmho/cm) |
| Footnotes | |
| A | Turbidity, a measure of cloudiness of the water, is an indicator of treatment performance. Turbidity was in compliance with the TT primary drinking water standard and the secondary drinking water standard of less than 5 NTU. |
| B | Compliance is based on monthly samples from treatment plant effluent (MWD) and the distribution system. |
| C | Metropolitan's compliance with the State MCL for aluminum is based on RAA. No secondary standard MCL exceedance occurred. |
| D | Metropolitan was in compliance with all provisions of the State's fluoridation system requirements. Fluoride feed systems were temporarily out of service during treatment plant shutdowns and/or maintenance work in 2024, resulting in occasional fluoride levels below 0.7 mg/L. |
| E | LVMWD is on a reduced monitoring schedule for Combined Radium-226+228. Sample results from 6/8/2020. |
| F | LVMWD is on a reduced monitoring schedule for Uranium. Sample results from 2/19/2020. |
| G | Compliance with the State and Federal MCLs is based on RAA or LRAA, as appropriate. Metropolitan plant core locations for TTHM and HAA5 are service connections specific to each of the treatment plant effluents. |
| H | Results in chart are for Metropolitan's Jensen Plant. Metropolitan's distribution system had a range of ND-2.8 and an average of ND for NDMA. |
| I | CCRDL is from DDW's Monitoring Order DW- 2025-0002-DDW for the 29 constituents detected by EPA Methods 533 and/or 537.1. Results below CCRDLs are considered "ND". |
| J | Voluntary monitoring of constituents provided for informational purposes. |
| K | Positive SI = non-corrosive; tendency to precipitate and/or deposit scale on pipes. Negative SI = corrosive; tendency to dissolve calcium carbonate. |
Additional Information About Drinking Water Safety and Standards
California Environmental Protection Agency - State Water Resources Control Board
1001 I St.
Sacramento, CA 95814
(916) 449-5577
waterboards.ca.gov/tiny/pws.shtml
U.S. Environmental Protection Agency (USEPA)
Office of Ground and Drinking Water
401 M St., SW
Washington, DC 20460
(800) 426-4791
epa.gov/safewater
U.S. Center for Disease Control and Prevention
1600 C